Javascript Anti Debugging - Crashing the Devtools [𝕏]
14 Nov 2023Originally posted on X
THIS WAS MEANT TO BE POSTED 1 MONTH AGO, BEFORE THE OCTOBER 7TH EVENTS 🇮🇱 SOME DETAILS MAY BE OUT OF DATE
Open Chrome devtools console @ https://weizmangal.com/awesome-javascript-anti-debugging and watch the entire chrome app CRASH @ v114 (or just the tab @ v116) 😈
Another NewGen Anti Debugging technique! 🧵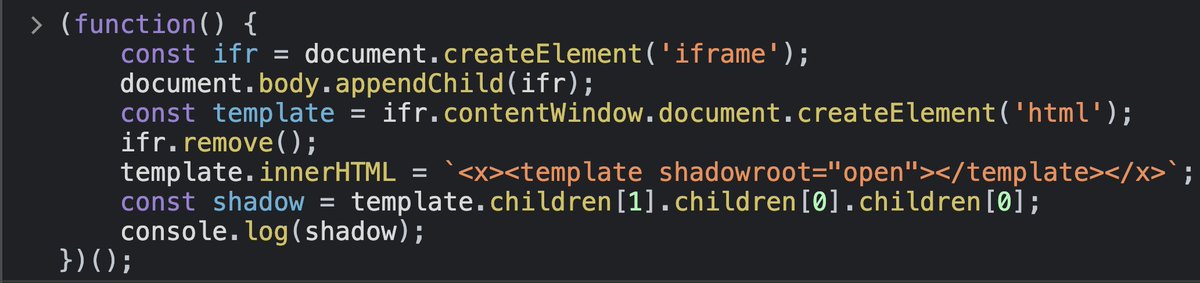
Why is this interesting?
Anti Debugging techniques are rather old, but NewGen ones which are more sophisticated can assist attackers to elegantly hide their attacks from victims who might attempt in uncovering them.
Victim opens devtools? → Attacker detects and runs away!
2/6
Here, combining with other NewGen* techniques, attackers can:
1. Detect debugging attempt
2. Mark user as potentially someone who can uncover the operation
3. Crash the tab
4. Use the mark to avoid attack when page is revisited next time
* What sets NewGens apart from OldGens?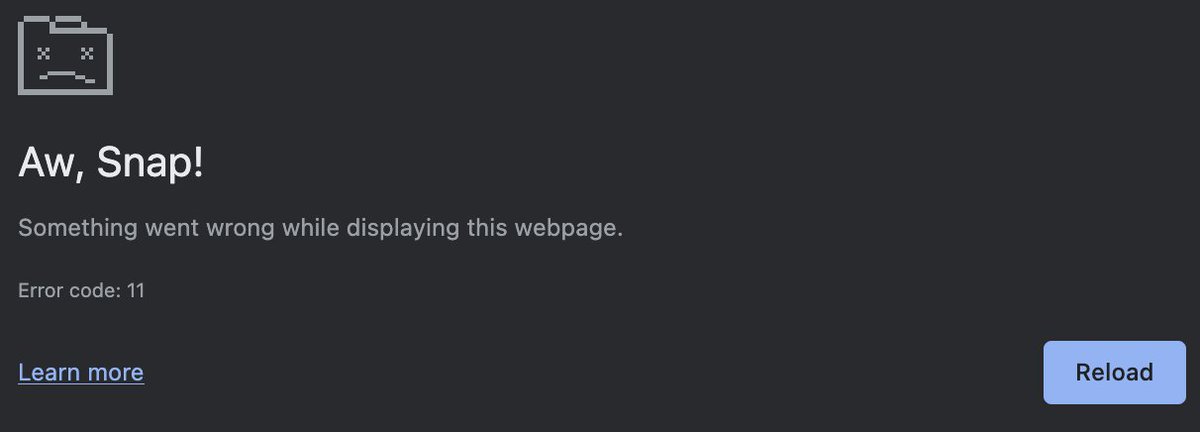
Mostly:
1. their sophistication level
2. what attackers can achieve with them
3. How hard they are to discover
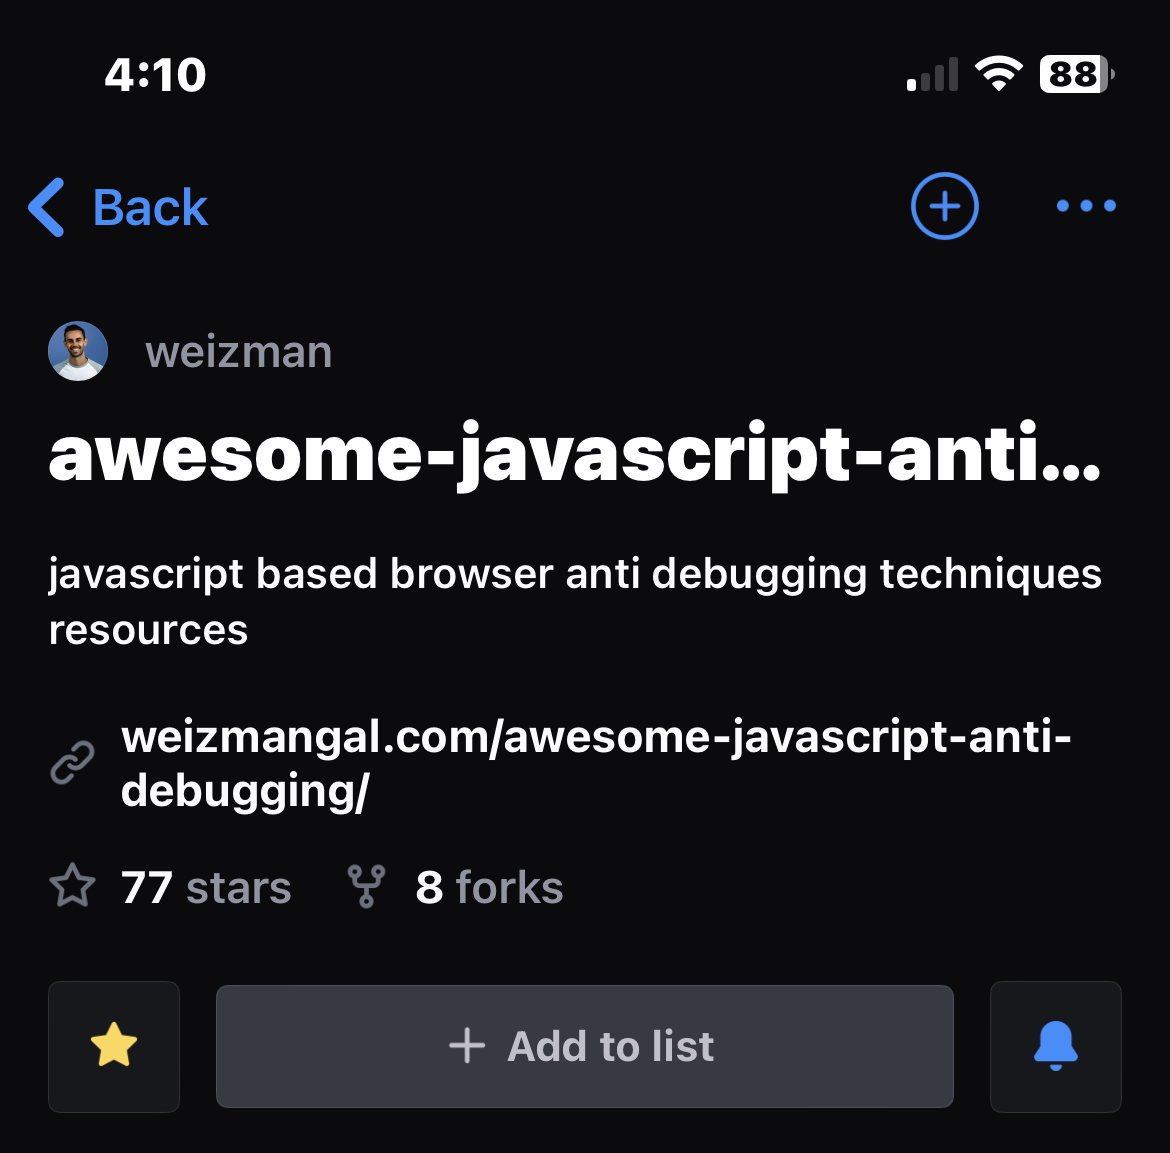
Learn more - visit the Awesome JavaScript Anti Debugging list ⭐ https://weizmangal.com/awesome-javascript-anti-debugging/
I encourage you further to learn more about the previous 2 NewGen techniques:
1. SourceMappingURL
2. ChromiumDevtoolsScopePane
Anti debugging techniques might not count as real vulnerabilities, but they matter, because they're being used by offensive security actors, and they save those from being uncovered weizmangal.com/awesome-javasc…
This was responsibly disclosed to Chromium and was decided to not be considered a security bug after being fixed:
https://bugs.chromium.org/p/chromium/issues/detail?id=1465129
At v114, this crashed the whole Chrome process entirely.
Since v116, it only crashed the relevant tab.
Since v118, this problem is fixed.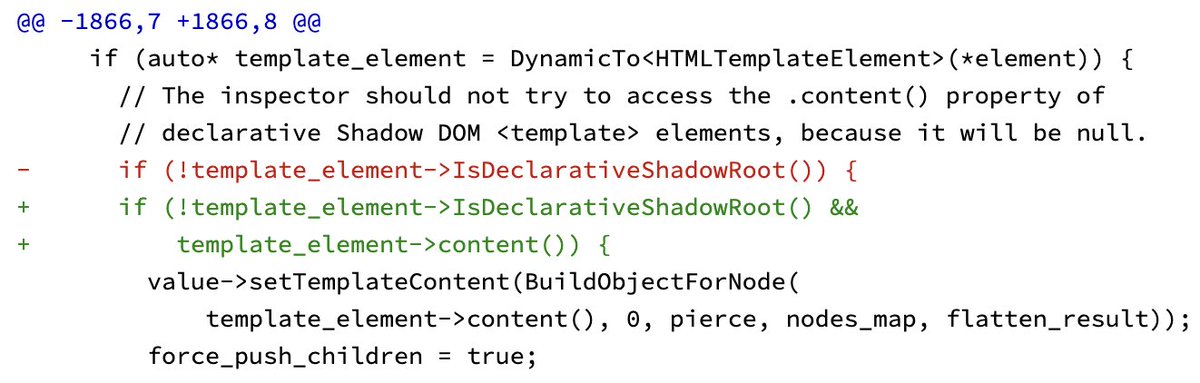
Open Chrome devtools console @ https://weizmangal.com/awesome-javascript-anti-debugging and watch the entire chrome app CRASH @ v114 (or just the tab @ v116) 😈
Another NewGen Anti Debugging technique! 🧵
Why is this interesting?
Anti Debugging techniques are rather old, but NewGen ones which are more sophisticated can assist attackers to elegantly hide their attacks from victims who might attempt in uncovering them.
Victim opens devtools? → Attacker detects and runs away!
2/6
Here, combining with other NewGen* techniques, attackers can:
1. Detect debugging attempt
2. Mark user as potentially someone who can uncover the operation
3. Crash the tab
4. Use the mark to avoid attack when page is revisited next time
* What sets NewGens apart from OldGens?
Mostly:
1. their sophistication level
2. what attackers can achieve with them
3. How hard they are to discover
Learn more - visit the Awesome JavaScript Anti Debugging list ⭐ https://weizmangal.com/awesome-javascript-anti-debugging/
I encourage you further to learn more about the previous 2 NewGen techniques:
1. SourceMappingURL
2. ChromiumDevtoolsScopePane
Anti debugging techniques might not count as real vulnerabilities, but they matter, because they're being used by offensive security actors, and they save those from being uncovered weizmangal.com/awesome-javasc…
This was responsibly disclosed to Chromium and was decided to not be considered a security bug after being fixed:
https://bugs.chromium.org/p/chromium/issues/detail?id=1465129
At v114, this crashed the whole Chrome process entirely.
Since v116, it only crashed the relevant tab.
Since v118, this problem is fixed.